
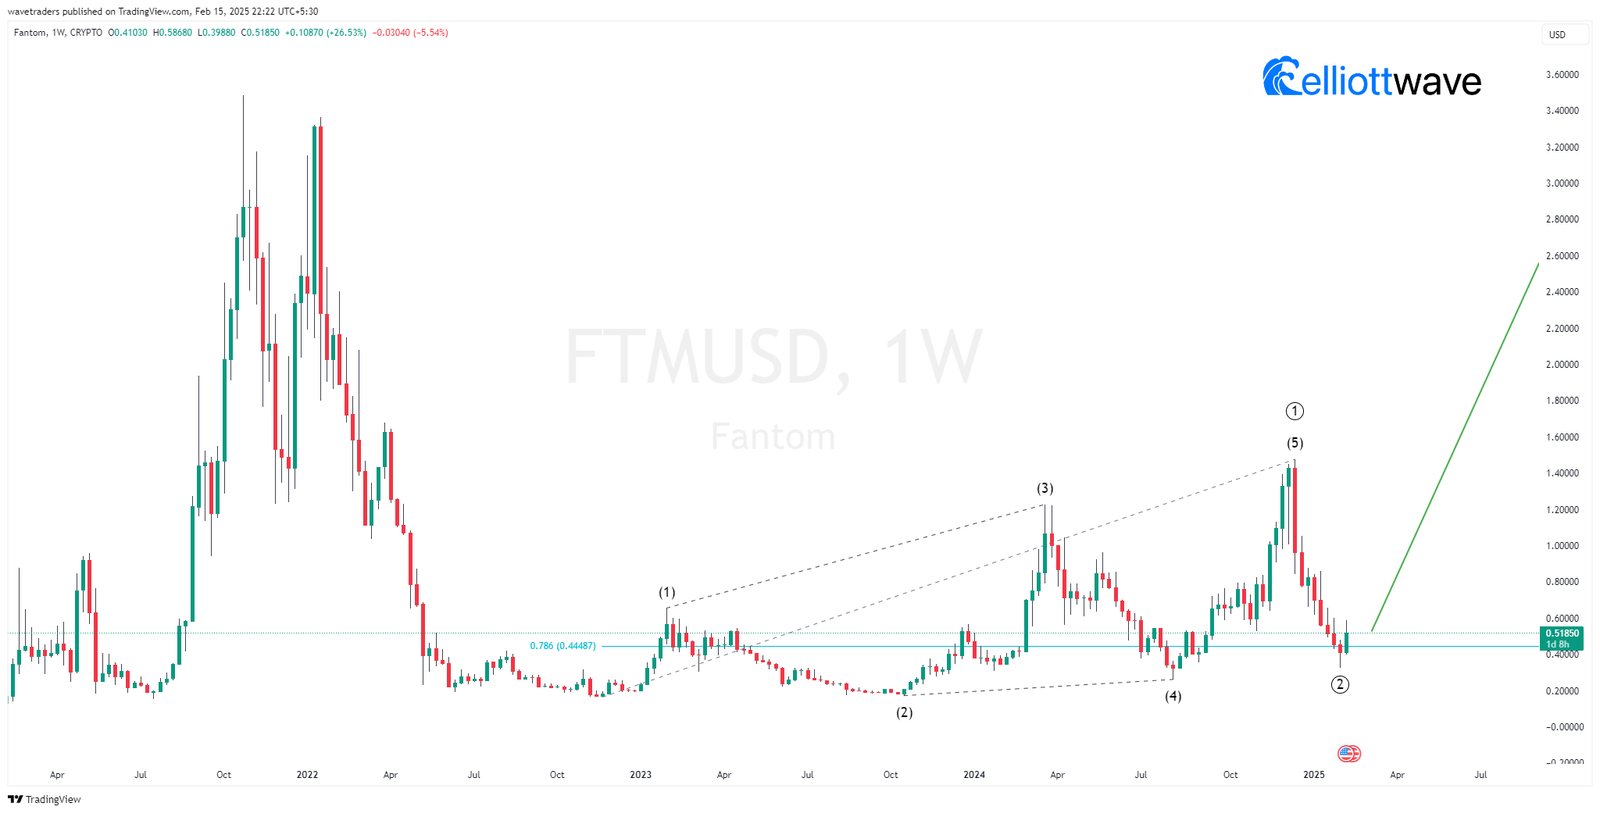
we observe a leading diagonal in the initial wave pattern, which is indicative of a strong initial move in the price of FTM. This pattern is typically seen at the beginning of a significant trend.
Following this, we see a corrective wave that retraced to the 0.786 Fibonacci level. This deep correction is a key point because it suggests that FTM has undergone a significant pullback, which is common in Elliott Wave patterns before resuming the primary trend.
Given this structure, it’s highly likely that FTM has formed or is about to form a significant low. This is a critical juncture as it suggests that the corrective phase might be nearing its end.
The expectation now is that after this correction, the price of FTM might resume its upward trend, potentially initiating Wave 3. This analysis points towards a bullish outlook once the corrective phase is complete.