

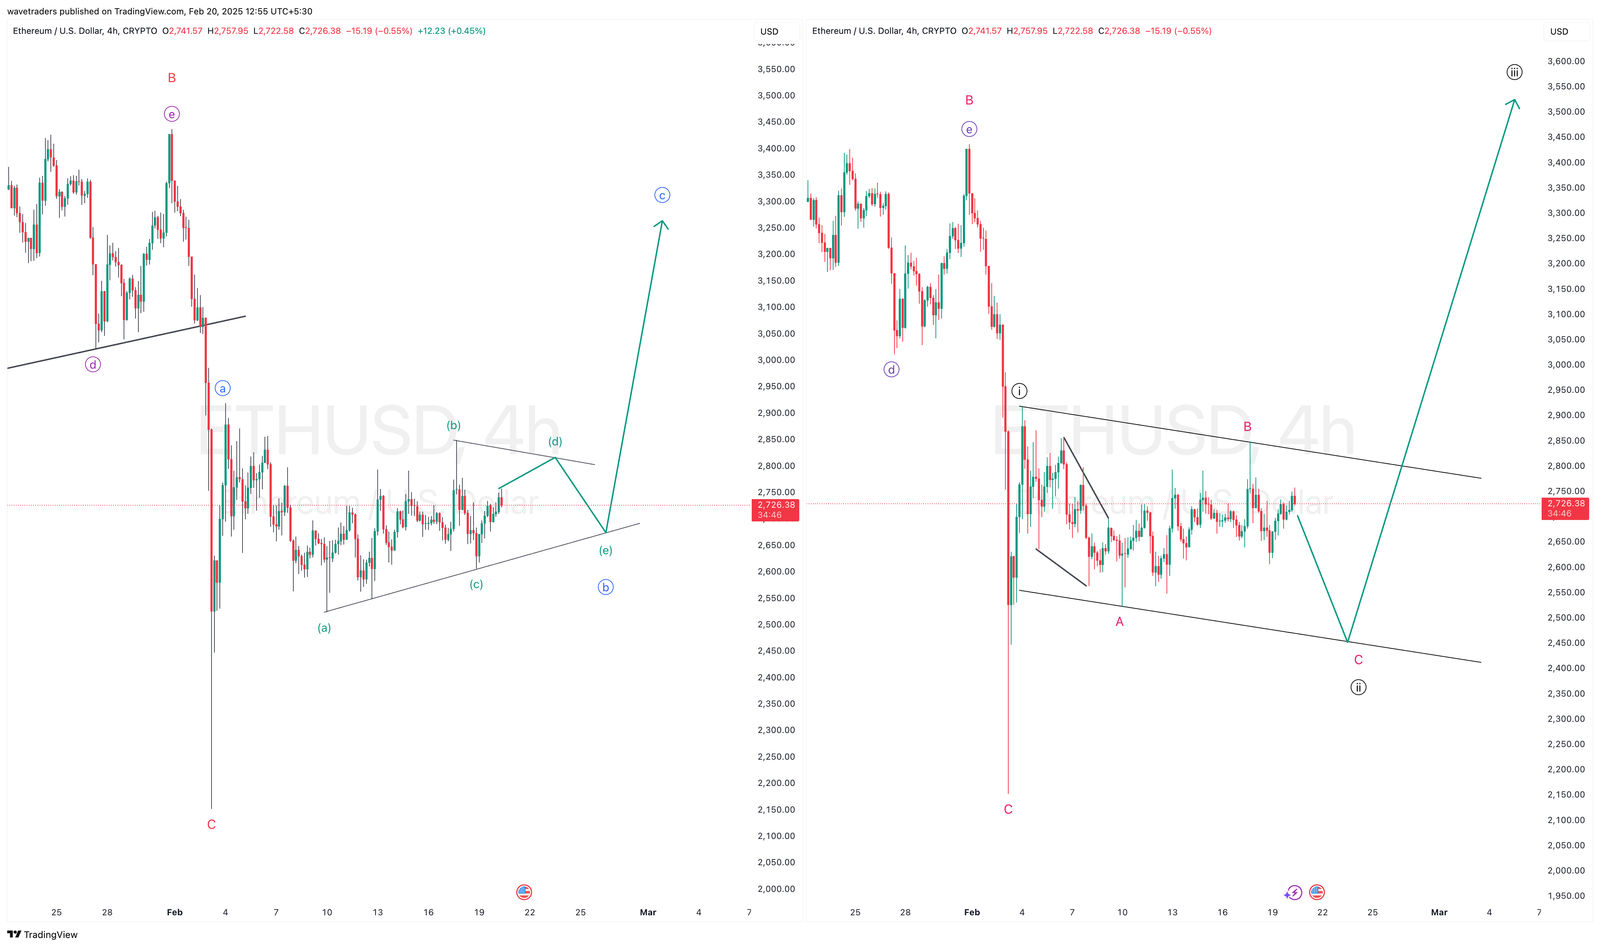
The chart outlines two potential Elliott Wave scenarios for ETH/USD on the 4-hour timeframe. Both projections ultimately anticipate a bullish breakout, but the paths differ in the short term.
1. Scenario 1 (Left Chart – Bullish Breakout Soon):
ETH appears to be forming a wave B triangle consolidation, indicating a potential breakout to the upside. If this structure holds, we could see an impulsive wave C rally, pushing prices higher without a deeper correction.
2. Scenario 2 (Right Chart – One More Drop Before Uptrend):
This outlook suggests that ETH is still within an A-B-C corrective structure, where wave B formed a complex correction. A final wave C dip toward lower support levels may play out before the next wave (iii) impulse surge begins.
Both scenarios point to bullish continuation, but whether we see an immediate breakout or a final dip first remains to be seen. Keep an eye on key levels for confirmation!