
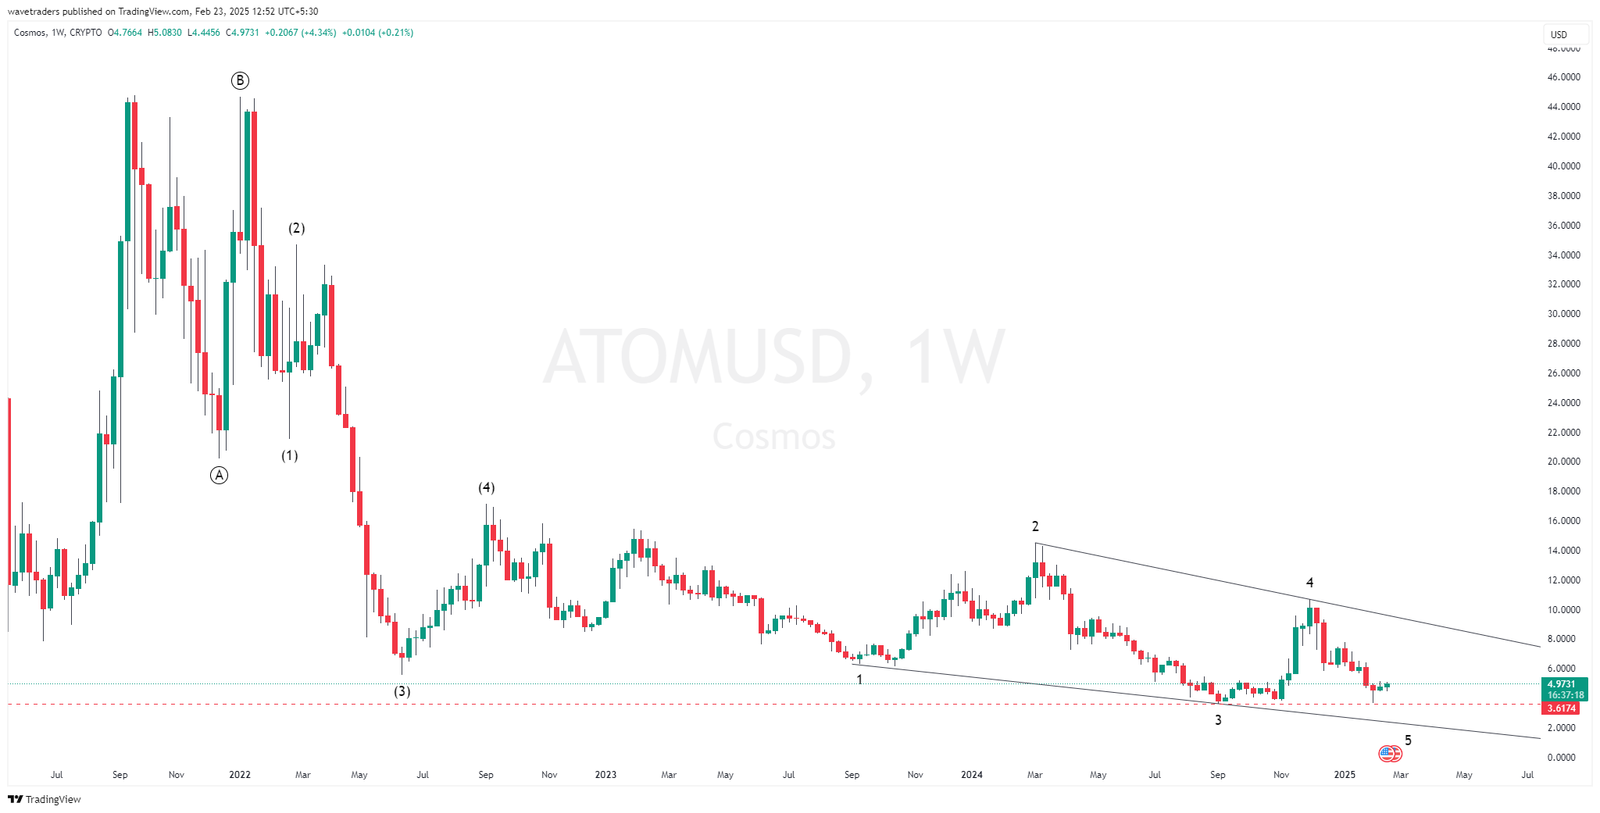
The ATOM/USD weekly chart presents a clear Elliott Wave structure, highlighting a Flat Correction (A-B-C). The correction unfolded as a regular flat, where wave B retraced close to wave A’s origin before giving way to a sharp wave C decline. This wave C is itself subdivided into a five-wave impulse, confirming its impulsive nature.
Currently, the final 5th wave of wave C is forming an Ending Diagonal, characterized by overlapping sub-waves and a contracting wedge structure. This pattern typically signals a loss of momentum and often precedes a strong reversal or corrective rally. If this structure completes as expected, ATOM could be setting up for a significant bounce or even a trend reversal. Traders should watch for confirmation signals near the lower boundary of the diagonal to assess potential bullish opportunities.