
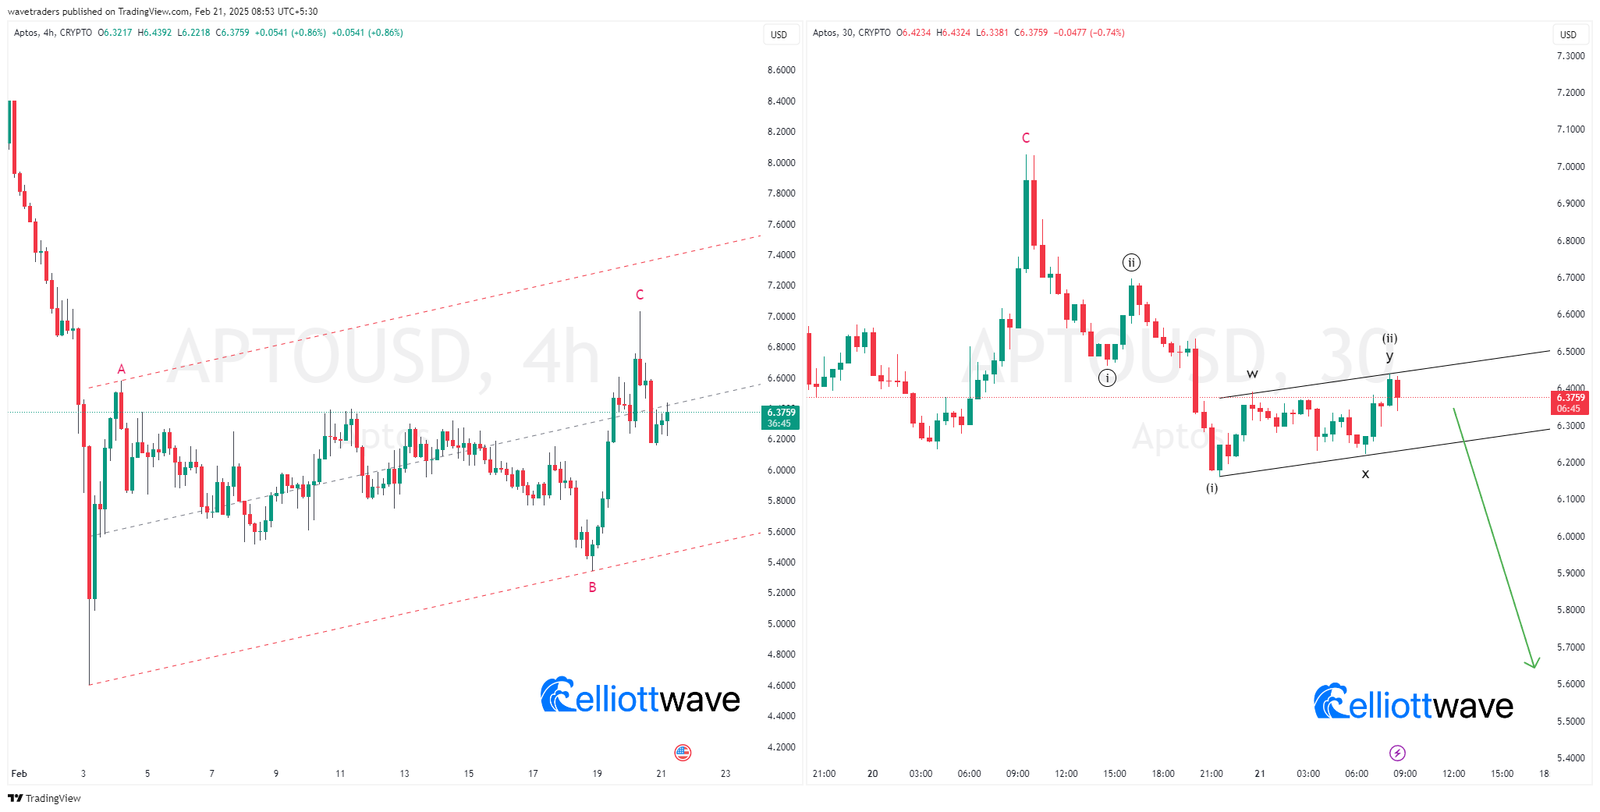
Left Chart (4H Timeframe) – Completed Corrective Pattern
- The market appears to have completed an A-B-C corrective structure within a larger trend.
- Wave C completed its move higher within the parallel channel and faced resistance zone near the upper boundary.
- The rejection from the Wave C peak suggests that a new impulsive decline may be unfolding.
Key Takeaways:
- The corrective phase appears complete.
- A potential bearish move is likely, confirming if price breaks below key support levels.
Right Chart (30M Timeframe) – Short-Term Bearish Setup
- A closer look at the recent structure suggests a W-X-Y corrective pattern, indicating a complex correction upwards.
- The move appears to be forming a lower high in Wave (ii), potentially marking the end of a corrective retracement.
- If price respects the parallel channel, a breakdown could initiate a sharp decline.
Key Takeaways:
- Price is struggling to break above resistance, forming a bearish structure.
- If the pattern holds, a strong downward impulse is expected.